
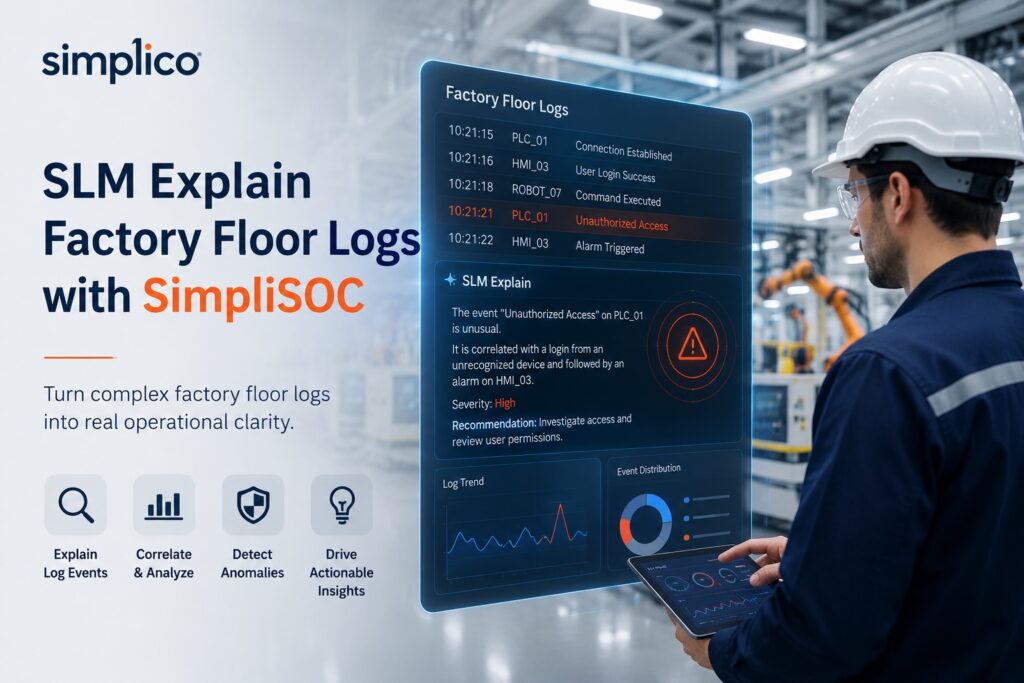
Two people at a Thai manufacturing plant get pinged by the same underlying event, and neither of them understands it the way they need to.
The SOC analyst — if there is one — sees a Wazuh alert: FC 15 write multiple coils, srcip 10.0.4.71, dst PLC-04, 02:14 local. That’s a security signal, and it’s readable if you already know Modbus function codes.
The shift supervisor sees nothing, or sees an HMI alarm that just says FAULT 0x22 and a red light. That’s an operational signal, and it’s readable if you already know what fault code 0x22 means on that specific line.
Neither of them is wrong to be confused. Both logs are compressed for machines, not people, and the person standing closest to the actual risk — physical or cyber — usually isn’t the one trained to decode the format it arrived in. This post covers a pattern for closing that gap with a local language model: one half of it is something simpliSOC already does in production today, and the other half is a natural extension of the same idea that we think is worth building toward.
1. Recap: getting visibility onto the OT layer in the first place
Before a model can explain anything, something has to be listening. We covered the visibility side of this in detail in Why Your Factory Floor Is the Softest Target in Your Network: a passive network TAP or SPAN port on the OT switch, a Zeek sensor decoding Modbus TCP and EtherNet/IP into structured logs, and a Wazuh agent shipping those logs to the SOC backend — all without sending a single active probe packet toward a PLC that might not handle it gracefully.
That architecture gets you a stream of structured OT events: who talked to which PLC, on what protocol, with which function code, at what time. It’s the raw material. The question this post is about is what happens to that stream after Wazuh has flagged something — and whether the same underlying idea can extend to the machine-health logs sitting right next to it.
flowchart TD
    PLC1["PLC Modbus TCP"]
    PLC2["PLC EtherNet IP"]
    HMI["HMI Workstation"]
    SW["OT Switch SPAN Port"]
    TAP["Network TAP"]
    ZEEK["Zeek Sensor"]
    WZ["Wazuh Manager OT Rules"]

    PLC1 --> SW
    PLC2 --> SW
    HMI --> SW
    SW --> TAP
    TAP --> ZEEK
    ZEEK --> WZ
2. Half one: explaining security alerts, today
This part is not speculative. simpliSOC’s AI-assisted triage — described on the simpliSOC product page — already runs a local LLM against qualifying Wazuh alerts, served through any OpenAI-compatible endpoint (Ollama, llama.cpp, vLLM, LocalAI) inside the client’s own network. It reads the alert plus surrounding activity and writes a plain-language explanation with a true or false-positive call, attached automatically or on demand.
Point that same mechanism at OT rules — the ones from the passive-tap architecture above — and the payoff is larger than it is for IT alerts, because the audience is different. A SOC analyst already speaks Wazuh. A plant engineer or shift supervisor generally doesn’t, and they’re often the first person actually near the equipment when something fires.
Compare the raw alert to what the model can hand back:
Raw Wazuh alert:
rule.id: 100045
rule.level: 12
agent: zeek-ot-sensor-01
modbus.func_code: 15
modbus.dst_ip: 10.0.2.14 (PLC-04)
modbus.src_ip: 10.0.4.71
timestamp: 2026-09-02T02:14:03+07:00
Model’s structured output:
{
  "severity": "high",
  "asset": "PLC-04 (extruder line 2)",
  "summary": "A host not seen writing to this PLC before sent a write-multiple-coils command at 2:14 AM, outside the scheduled 22:00-23:00 maintenance window.",
  "context_check": "No maintenance ticket open for line 2 tonight. Source IP does not match the vendor VPN range.",
  "recommended_action": "escalate_and_verify_physically",
  "confidence": 0.78
}
That second block is something a shift supervisor can act on without knowing what a coil is. The model isn’t inventing the maintenance-window comparison — the SOC Integrator pulls that context (open tickets, known vendor IP ranges) the same way it already does for IT alerts, per the pattern described in Using Small Language Models to Detect Cyber Attacks from Wazuh Logs and Firewall Syslog. The only real change for OT is the vocabulary in the prompt and the fields the SOC Integrator enriches with — asset names instead of usernames, maintenance windows instead of office hours, vendor VPN ranges instead of employee IP ranges.
3. Half two: the same pattern, pointed at machine-health logs — a roadmap idea, not a shipped feature
Here’s where it’s important to be precise about what exists versus what we think should exist. simpliSOC is a security stack. It does not read PLC fault codes, historian tag drift, or HMI alarm logs today, and nothing in this section describes a current simpliSOC capability.
What we do think is worth building: the same local model, served from the same on-premise endpoint, given a second job. Instead of reading Wazuh OT alerts, it reads the operational log stream that a system like simpliFactory already captures at the shop-floor level — fault codes, tag values drifting outside spec, alarm bursts on an HMI — and produces the same kind of plain-language, structured explanation, aimed at a maintenance technician instead of a security analyst.
The economics are the reason this is worth more than a diagram. A 7B–14B model sized and run locally along the lines covered in Choosing Hardware for Local LLMs in 2026: A Practical Sizing Guide is cheap enough per call that it doesn’t need to justify itself on one workload alone. Once a plant has a local endpoint doing security triage, adding a second consumer with a different prompt and a different output schema is closer to a config change than a new project — that’s the whole argument for the on-premise route in the first place, covered in Why Enterprises in Southeast Asia and Japan Are Moving LLMs Inside the Firewall.
flowchart TD
    OTLOG["OT Security Log Stream Wazuh"]
    MESLOG["Machine Health Log Stream MES Historian"]
    LLM["Local LLM Endpoint Ollama or vLLM"]
    SOCOUT["Plain Language Security Explanation"]
    MESOUT["Plain Language Fault Explanation Roadmap"]

    OTLOG --> LLM
    MESLOG --> LLM
    LLM --> SOCOUT
    LLM --> MESOUT
What the structured output might look like on the machine-health side — again, illustrative of the pattern, not a live schema:
{
  "asset": "Extruder Line 2 - Zone 3 Heater",
  "fault_code": "0x22",
  "summary": "Zone 3 temperature has drifted 8 percent below setpoint over the last 40 minutes, consistent with a partially failed heating element rather than a sensor fault.",
  "similar_history": "Same drift pattern preceded a Zone 3 heater replacement on 2026-03-14.",
  "recommended_action": "schedule_inspection_before_next_shift",
  "confidence": 0.65
}
Two things distinguish this from off-the-shelf predictive maintenance software: it runs on the same on-premise model already justified by the security use case, and it’s explaining a fault in the maintenance team’s language rather than asking them to read a trend chart.
4. Guardrails apply to both halves, and OT raises the stakes
The rule from the security side carries over directly, and matters more here, not less: the model is advisory only. It summarizes, classifies, and recommends. It never auto-closes a security case and it never auto-adjusts a setpoint or auto-acknowledges a machine alarm. A human confirms every action above a defined severity threshold.
This matters more in OT than in IT because the failure modes are physical. Getting a false positive wrong on an IT alert wastes an analyst’s time. Getting a false negative wrong on "ignore this, it’s just the heater drifting" when it’s actually an unauthorized setpoint change is a different category of consequence — and the reverse, treating a genuine mechanical fault as a security incident, means a plant halts a production line for the wrong reason. Neither the security half nor the machine-health half of this pattern should be trusted to decide; both should be trusted to explain, quickly, to the person who does decide.
The other guardrail carries over from the OT visibility work directly: nothing here writes to a PLC, adjusts a setpoint, or takes an active action on the OT network. The model reads logs that already exist and produces text. That’s the same passive posture the Zeek sensor uses, extended into the reasoning layer instead of stopping at the collection layer.
5. What this means for a factory security or MES conversation
If you’re running Wazuh with OT rules already, extending the local-LLM explanation layer to those alerts is a scoping conversation, not a new architecture — it reuses the endpoint, the SOC Integrator’s enrichment pattern, and the guardrail design already in production for IT alerts.
If you’re earlier in the process — you have an MES capturing shop-floor data but no OT security visibility yet, or vice versa — the sequencing question is which stream to instrument first. Our default recommendation is the passive OT tap and Wazuh rules described in the June post, because that’s the gap with the highest downside (an unmonitored OT network is a live risk today), with the local-LLM explanation layer and the machine-health extension following once there’s a log stream worth explaining.
FAQ
Does simpliSOC currently diagnose machine faults, not just security events?
No. simpliSOC’s local-LLM triage is a shipping feature for security alerts. The machine-health application described in this post is a proposed extension of the same architecture, not a current capability.
Does any of this send factory data outside the plant network?
No. The local LLM runs on hardware inside the client’s own network, served through an OpenAI-compatible endpoint (Ollama, llama.cpp, vLLM, or LocalAI). Nothing — security logs or machine logs — leaves the network for this to work.
Can the model take action on a PLC or adjust a setpoint?
No. It only reads structured log data and produces text. Every recommended action requires a human to execute it, and nothing in this pattern writes back to OT equipment.
What if we don’t have OT network visibility yet?
Start there. The local-LLM explanation layer needs a log stream to read, and the passive Zeek/Wazuh tap described in our OT visibility post is the lowest-risk way to get one without touching a live PLC.
Sources:
- simpliSOC — Open-Source Security Operations Platform
- Why Your Factory Floor Is the Softest Target in Your Network
- Using Small Language Models to Detect Cyber Attacks from Wazuh Logs and Firewall Syslog
- Choosing Hardware for Local LLMs in 2026: A Practical Sizing Guide
- Why Enterprises in Southeast Asia and Japan Are Moving LLMs Inside the Firewall
- simpliFactory
Latest Posts
- E-invoicing in Vietnam and Malaysia: what your POS or ERP has to do before the penalties start October 22, 2026
- CBAM for suppliers: what your EU buyer will ask you for, and the data to start collecting now October 22, 2026
- Scoping an EV Charging Platform for a Large Property Owner: Two Driver Apps, a Prepaid Wallet and Three Levels of Trust October 20, 2026
- The Site Host Problem: Giving a Condo, Hotel or Restaurant Its Own Charger Dashboard Without Another Account to Manage October 17, 2026
- Why AI Agents Stall in Southeast Asian Enterprises, and the Trust Layer That Gets Them Live October 15, 2026
- Which Product Should a Creator Promote? An Idea We Want to Test October 14, 2026